Teacher Questionnaire
Results:
Part A Demographic
information
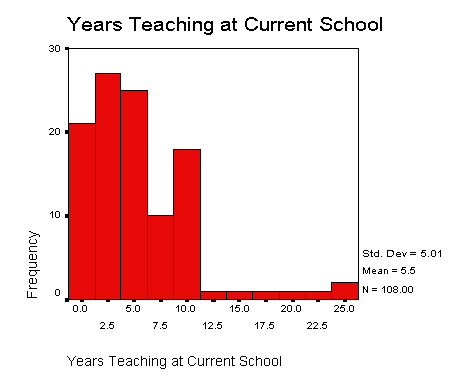
5. Number of years at this particular school:
Please use your
“back button” to return to the Teacher Questionnaire
|
Statistics
|
||
|
N |
Valid |
108 |
|
Missing |
3 |
|
|
Mean |
5.531 |
|
|
Percentiles |
25 |
2.000 |
|
50 |
4.000 |
|
|
75 |
8.000 |
|